52-Week High Breakout Momentum: The Beginner-Friendly Trend-Following Strategy
A 52-week high breakout strategy systematically buys stocks at the moment their price closes above the highest level reached during the prior 12 months, on the thesis that stocks making new annual highs tend to keep going.
It is the most accessible entry point into momentum investing because the rule is unambiguous, the data is on every chart, and the academic record is unusually strong for a strategy this simple.
TL;DR: Filter for liquid, mid-cap-or-larger stocks. Require a close at — or within 2% of — the 52-week high. Add a volume surge filter so you only catch real demand, not thin-trade drift. Confirm the move with positive relative strength, rising EPS growth, and a moving average stack that is trending up. Use a hard 7–8% stop-loss on every entry. In ScreenerHub, build a momentum-and-growth shortlist first, then check proximity to the 52-week high, moving averages and volume manually. → Open the candidate screen →.
If you have not seen the underlying concept yet, start with What Is the 52-Week High/Low? — this page focuses on the strategy (entry rules, filters, portfolio construction, exits) rather than the metric definition.
Origin: Donchian, O'Neil, and the Academic Momentum Premium
The 52-week high breakout is one of the oldest documented systematic strategies in markets.
- Richard Donchian (1950s–1970s). A pioneer of trend following who built the original "channel breakout" rule: buy when price closes above the highest high of the past N days. The 52-week (252-trading-day) window became the most-cited variant.
- William O'Neil (1988, How to Make Money in Stocks). Embedded the 52-week high in the CANSLIM framework. O'Neil's research at Investor's Business Daily found that historical multi-baggers almost always emerged from a base near their 52-week high — not from new lows.
- Thomas George and Chuan-Yang Hwang (2004). Their Journal of Finance paper "The 52-Week High and Momentum Investing" showed that the nearness to the 52-week high is itself a stronger predictor of future six-month returns than traditional momentum metrics like trailing 12-month returns. The price anchor matters.
The combined thesis is simple. A stock at a new 52-week high has, by definition, no overhead supply — every prior buyer is sitting on a gain, so there is no trapped seller waiting to dump on the first bounce. That structural absence of resistance, plus the behavioural reluctance of investors to chase highs, creates a measurable persistence of returns.
Honest caveat: Naive breakout buying — without volume, trend, and quality filters — produces a high false-positive rate. Roughly 60–70% of raw breakouts fail within six weeks. The filters in this strategy exist to push the success rate into a tradeable range, not to deliver certainty.
The Exact Recipe
This strategy specifies entry signals, confirmation filters, and a non-negotiable exit rule.
Step 1 — Define the universe
Start with the full investable universe of stocks, then exclude:
| Exclusion | Why |
|---|---|
| Micro-caps | Below $300M market cap, breakouts are dominated by single-trade noise |
| Illiquid names | Below ~$2M average daily dollar volume, slippage destroys the edge |
| OTC / pink sheets | Reporting quality and execution are unreliable |
| Recent IPOs (< 6 mo.) | No real 52-week history yet; the "high" is mechanically the all-time high |
| Penny stocks (< $5) | Statistically dominated by failed breakouts and pump-and-dump dynamics |
Step 2 — The breakout trigger
The pure rule is: a daily close at or above the 52-week high. In practice, most disciplined practitioners loosen this slightly to capture the broader breakout window:
| Trigger Variant | Setting | When to Use |
|---|---|---|
| Strict breakout | Close ≥ 52W high | You want the cleanest signal, accept fewer candidates |
| Within 2% of high | % from 52W high ≥ -2% | You want a buyable shortlist, including pre-breakouts |
| Position in range > 95% | Calculated from formula above | You want a normalised filter that works across markets |
Step 3 — Confirmation filters
A breakout without confirmation is a guess. Three filters historically improve hit rate the most.
| Filter | Setting | Why |
|---|---|---|
| Volume surge | Day volume ≥ 1.5× 50-day avg | Real institutional accumulation prints; a breakout on thin volume is usually fake |
| Trend stack | Price > 50-day SMA > 200-day SMA | Confirms the breakout occurs inside an existing uptrend, not as a counter-trend bounce |
| Relative Strength | RS rating ≥ 80 (top 20% of market) | Filters out breakouts that are merely keeping pace with a rising market |
Step 4 — Quality overlay (optional but recommended)
Pure technical breakouts work — but adding a light fundamental layer cuts the false-positive rate measurably and keeps you out of the worst story-stock blow-ups.
| Filter | Setting | Why |
|---|---|---|
| EPS growth (latest quarter, YoY) | > 20% | Aligns with O'Neil's CANSLIM "C" criterion; real businesses accelerating |
| Revenue growth (latest quarter, YoY) | > 10% | Avoids EPS gains driven only by buybacks or one-time items |
| Sector strength | Top 50% by RS | Industry-group leaders break out cleaner and more often than isolated stragglers |
Step 5 — Portfolio construction and exits
The strategy lives or dies on disciplined exits. The entry is easy; the stop is the entire edge.
| Rule | Setting |
|---|---|
| Number of positions | 8–15 concurrent names |
| Position sizing | Equal-weight, or volatility-adjusted using ATR |
| Hard stop-loss | 7–8% below entry, no exceptions — this is the original O'Neil rule and the single most important one |
| Profit-taking | Trail a 10-week or 50-day moving average; exit on the first close below |
| Re-entry | Allowed if the stock prints a fresh breakout from a new base |
| Holding period | Variable — typically 4–12 weeks for trades, 6–18 months for trends that persist |
The 7–8% stop is not negotiable. The asymmetry of momentum payoffs — a small number of trades produce most of the return — only works if losers are cut quickly enough that winners can compound.
Why the Strategy Works (When It Does)
The 52-week high breakout harvests three reinforcing effects.
- Behavioural anchoring. Investors anchor on prior price levels. A stock pushing through a 12-month resistance has overcome the largest available pool of latent sellers — the people who bought during the prior peak and were waiting "to get out at break-even."
- Information catalyst signal. New 52-week highs typically follow a real-world catalyst — an earnings beat, a guide-up, a contract win, a regulatory approval. Price often moves before the news is fully understood by the wider market.
- Institutional ownership accumulation. Funds with formal momentum mandates (and many ETFs) cannot buy a stock until it ranks in the top deciles of their universe. A breakout often triggers programmatic accumulation that lasts weeks, not days.
What it is really selecting for
| Confirmation Quality | Typical Profile |
|---|---|
| Breakout + volume + trend + RS + EPS | High-conviction setup — the historical sweet spot |
| Breakout + volume + trend | Solid technical setup; works in broad bull markets |
| Breakout + trend, no volume | Often a false move; success rate drops sharply |
| Breakout, no trend (e.g., recovery from low) | A counter-trend bounce; works occasionally but not the strategy this page covers |
Building the Strategy in ScreenerHub
Studio can narrow the candidates using performance, growth and size filters. It does not currently provide a percentage-from-52-week-high filter, a percentile RS rating, average dollar volume, or a volume-versus-average ratio. Its SMA fields are price levels, not automatic rules comparing price with a moving average.
Treat the screen below as a candidate list. Confirm the actual breakout on a chart after screening. Sign in to use the required filters; monetary examples use USD.
Recipe 1 — Growth and momentum candidates
| Studio filter | Setting |
|---|---|
| Market Cap | > $500M |
| Perf 3M | > 10% |
| Relative Strength (Levy) | > 1.0 |
| EPS Growth YoY | > 25% |
| Revenue Growth YoY | > 15% |
Sort by Relative Strength (Levy) descending. This ratio compares price with its own trend baseline; it is not an RS percentile rating, so a value of 1.0 does not mean a rating of 80. Use the growth fields under their displayed definitions rather than assuming they reproduce CANSLIM's latest-quarter tests.
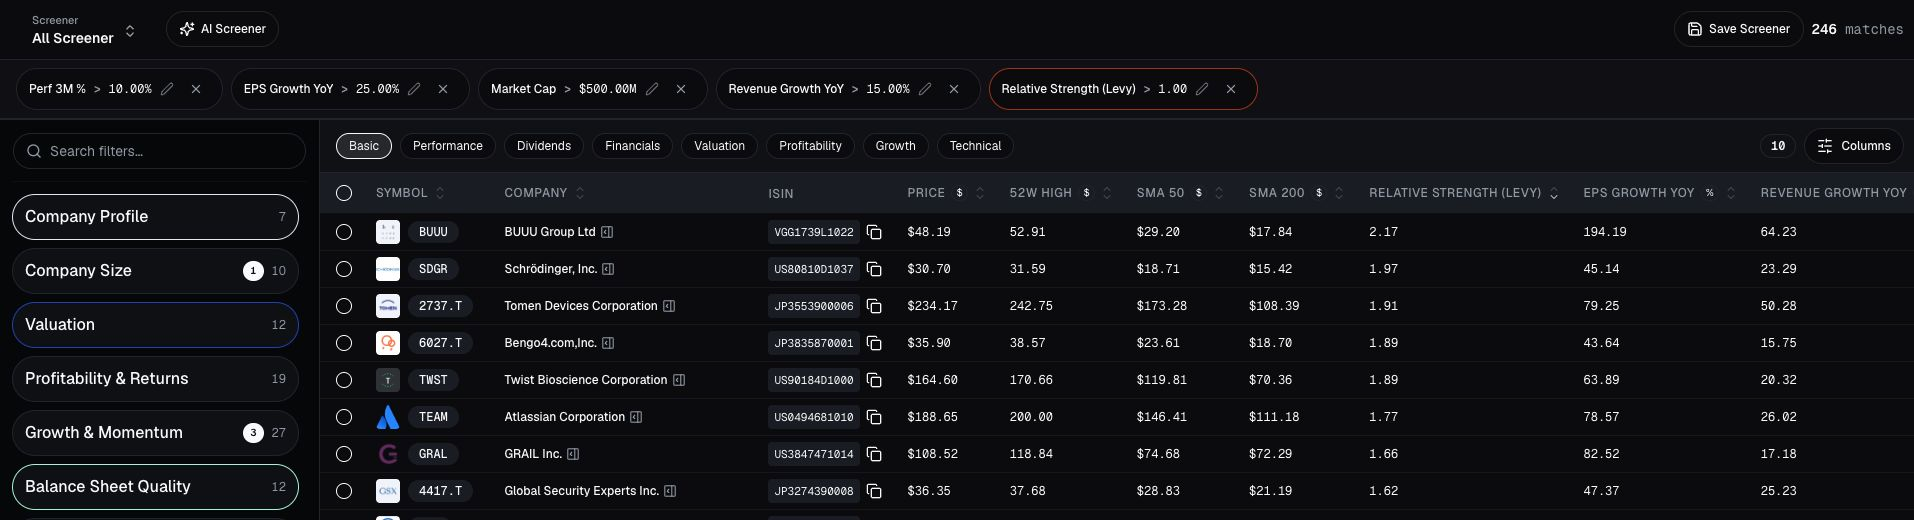
A candidate list for manual breakout review, not an automatic breakout signal. Captured September 23, 2026; matches and prices change. Select the image to view it full size.
Open these five criteria in Studio
The link also selects Price, 52W High, SMA 50 and SMA 200 as result columns. These columns help you review the setup; displaying them does not filter out stocks below their high or moving averages.
Confirm the breakout manually
For each candidate:
- Compare Price with 52W High. To calculate distance from the high, use
(Price / 52W High − 1) × 100. For the near-breakout window, look for a value between −2% and 0%. This differs from the position-in-range formula earlier in the article. - Compare price with SMA 50 and SMA 200, then inspect the chart to confirm the trend and a close above the prior high. A current snapshot alone cannot establish when a breakout occurred.
- Check average daily dollar volume and the day's volume relative to its historical average in your charting tool. Studio's Volume field is not a substitute for either ratio.
- Verify the latest quarterly earnings and revenue figures, upcoming earnings dates, and liquidity before treating the candidate as a confirmed setup.
Recipe 2 — Technical candidates without fundamentals
Start with the technical momentum screen: Market Cap > $500M, Perf 1M > 8%, Perf 3M > 15%, RSI (14) between 60 and 75, and Relative Strength (Levy) > 1.05. Raise the market-cap floor to $1B if desired. Then apply the same manual price, moving-average and volume checks. The screen itself does not detect a new 52-week high.
Recipe 3 — Large-cap candidates with a quality overlay
In Studio, use Market Cap > $5B, ROE > 15%, Debt/Equity < 1.0, and EPS Growth YoY > 15%. Review price within 3% of the 52-week high and above SMA 200 manually. These additional checks remain necessary even when the fundamental criteria pass.
When the Strategy Misleads
A breakout screen is a starting point, not a verdict. Five recurring failure modes are worth respecting.
- Late-cycle false breakouts. In the final weeks of a bull market, breakouts become more frequent and less profitable as marginal buyers chase the last move. Watch the percentage of stocks on the market hitting new 52-week highs as a regime gauge — when it spikes and then fades, hit rate drops.
- Index-driven breakouts. A stock making a new 52-week high only because the broader index is making one is not a breakout — it is beta. The RS rating filter exists exactly to remove these.
- Earnings-gap traps. A stock that gaps above its 52-week high on an earnings report often gives back the entire move within 48 hours as algorithmic short-sellers fade the gap. Many practitioners wait one full day after an earnings gap before triggering.
- Low-float pumps. In small-caps especially, a "breakout" can be a coordinated low-float squeeze with no business catalyst. The $300M market-cap and $2M daily volume floors are designed to filter these out — do not relax them.
- Choppy / range-bound markets. In a sideways market the strategy produces a death-by-thousand-cuts pattern of small losses. Most disciplined practitioners stand down — or shift to mean-reversion — when fewer than ~30% of liquid stocks trade above their 200-day SMA.
52-Week High Breakout vs. Related Strategies
| Strategy | What It Targets | When to Prefer It |
|---|---|---|
| 52-Week High Breakout (this page) | Stocks at fresh annual highs | You want a clean, unambiguous trend-entry rule with a strict stop |
| Relative Strength leadership | Top-decile RS regardless of breakout | You prefer a continuous ranking signal over a discrete breakout trigger |
| Moving Average crossovers | 50-day crossing above 200-day (golden cross) | You want longer-horizon trend signals with fewer trades per year |
| Momentum screening (general) | Broad mix of momentum indicators | You want a wider funnel before applying any one specific entry rule |
| Quality compounders | High ROIC + low debt, valuation secondary | You prioritise multi-year compounding over short-to-medium-term price runs |
Frequently Asked Questions
How many stocks should I hold at once?
Most practitioners run 8–15 concurrent positions. Fewer than 8 concentrates single-name risk on a strategy with a known high false-positive rate. More than 15 starts to dilute the edge and becomes hard to monitor for stop-loss triggers.
What stop-loss should I use?
The original O'Neil rule is 7–8% below entry, with no exceptions. The asymmetry of momentum — a few big winners pay for many small losers — only works if losers are cut before they compound. Volatility-adjusted stops using ATR (typically 2× ATR below entry) are a more sophisticated alternative.
Does the 52-week high breakout still work after Donchian and O'Neil?
The 2004 George–Hwang paper, plus replications through the 2010s, continued to find a measurable premium for stocks near their 52-week high — though with thinner margins and longer drawdown periods than the pre-2000 era. The structural reasons (anchoring, information catalysts, fund accumulation) are intact. Expect lower returns than the historical back-tests imply, with the same psychological discipline required.
Why exclude IPOs and penny stocks?
IPOs have no real 52-week history — every "high" is mechanically the all-time high, and the breakout signal is meaningless. Penny stocks (below $5) are statistically dominated by failed breakouts and manipulative price action. Both populations destroy the edge if included.
Can I run a 52-week high breakout strategy on European or emerging-market stocks?
Yes — the underlying anchoring and trend effects are not US-specific. Coverage of relative-strength rankings and intra-day volume data is weaker outside North America and large-cap Europe, so stick to liquid universes (FTSE 350, STOXX 600, large-cap MSCI EM) and tighten the market-cap floor to compensate.
What if a stock breaks out, I miss the trigger, and it keeps going?
Do not chase. Wait for the stock to pull back to its 50-day moving average — or for the price to print a new, tighter base and break out again. Buying 10–15% above the original breakout level wrecks the risk/reward and turns the 7–8% stop from a discipline into a guaranteed loss.
Keep Learning
- What Is the 52-Week High/Low? — the metric behind this strategy
- What Is Relative Strength? — the confirmation filter that separates real leaders from index-followers
- What Is a Moving Average? — the trend filter underpinning the SMA stack rule
- What Is EPS Growth? — the fundamental overlay used in the CANSLIM-style recipe
- How to Screen for Momentum Stocks — the broader momentum workflow this strategy sits inside
- How to Use Technical Filters in a Stock Screener — the mechanics of building technical screens in ScreenerHub