Greenblatt's Magic Formula: The Ranked-List Strategy for Cheap, Quality Stocks
Greenblatt's Magic Formula is a rules-based investing strategy that ranks every eligible stock on two factors — earnings yield and return on capital — sums the ranks, and buys the top names as a diversified basket held for one year.
It is one of the most cited systematic value strategies of the last two decades because the recipe is small enough to fit on an index card and disciplined enough to follow without judgement calls.
TL;DR: Filter out banks, utilities, and micro-caps. Rank the rest by earnings yield (EBIT / EV) and by return on capital (EBIT / tangible capital). Add the two ranks. Buy the 20–30 best-ranked names, equal-weight. Hold for one year, then re-rank and rebalance. On ScreenerHub the closest practical approximation is ROIC plus low EV/EBITDA, filtered for size and sector. → Run the screen in Studio.
If you have not seen the underlying concept yet, start with What Is the Magic Formula? — this page focuses on the strategy (universe, ranking rules, portfolio construction, rebalancing) rather than the metric definitions.
Origin: Joel Greenblatt and The Little Book
Joel Greenblatt published The Little Book That Beats the Market in 2005 (revised in 2010). Greenblatt is a hedge-fund manager (Gotham Capital) and an adjunct professor at Columbia Business School, where he teaches in the same value-investing tradition as Graham, Dodd, and Buffett.
His thesis is unusually simple. Long-term outperformance does not require forecasting earnings, modelling discount rates, or interviewing management. It requires two things at the same time:
- A cheap entry price — measured by earnings yield, not P/E.
- A good business — measured by return on capital, not just net income.
The Magic Formula is the operational version of that thesis. Greenblatt argued — and back-tested — that ranking the U.S. market on both factors and buying the top 20–30 names had historically outperformed the S&P 500 by a wide margin from 1988 to 2004.
Honest caveat: The original back-test used a clean academic dataset and ignored taxes, slippage, and survivorship bias. Live-money implementations since 2005 have been less dramatic, and the strategy has had multi-year stretches of underperformance. The framework still works as a disciplined screen, but expectations should be calibrated.
The Exact Recipe
The Magic Formula is one of the few investing strategies that can be specified in five steps.
Step 1 — Define the universe
Start with the full investable universe of stocks, then exclude:
| Exclusion | Why |
|---|---|
| Financial stocks | Banks and insurers do not have a comparable EBIT or operating-capital structure |
| Utilities | Regulated returns distort the formula's quality signal |
| Micro-caps | Greenblatt's original rule is market cap above $50M; most practitioners now use $200M–$500M for liquidity |
| ADRs of opaque issuers | Reported numbers may not be comparable to domestic peers |
Step 2 — Rank on earnings yield
Higher is better. The cheapest stock in the universe gets rank 1.
Step 3 — Rank on return on capital
Higher is better. The most capital-efficient stock gets rank 1.
Step 4 — Combine the ranks
Add the two ranks together. A stock that is rank 12 on earnings yield and rank 38 on return on capital scores 50. Lowest combined score wins.
Step 5 — Build the portfolio
| Rule | Greenblatt's Default |
|---|---|
| Number of holdings | 20–30 stocks |
| Position sizing | Equal-weight |
| Holding period | 12 months per position |
| Rebalancing cadence | Stagger — add 5–7 names per quarter |
| Tax-loss harvesting | Sell losers just before the 1-year mark, winners just after |
The staggered rebalancing is deliberate: it spreads tax events and avoids selling the entire portfolio in one bad month.
Why the Strategy Works (When It Does)
The Magic Formula tries to harvest two well-documented return premiums at the same time:
- Value premium. Cheap stocks have historically outperformed expensive stocks over long horizons (Fama and French, 1992).
- Quality premium. High-profitability and high-capital-efficiency firms have historically outperformed low-quality firms (Novy-Marx, 2013; Asness, Frazzini, Pedersen, 2013).
Either premium alone produces well-known failure modes — value traps on one side, expensive compounders on the other. Combining them with a simple rank-sum is a crude but effective way to demand both at once.
What it is really selecting for
| Combined Rank Bucket | Typical Profile |
|---|---|
| Best 30 names | Cheap, capital-efficient operators — the target portfolio |
| Top decile | Strong on at least one factor and acceptable on the other |
| Middle 50% | Average businesses at fair valuations |
| Bottom decile | Expensive low-return businesses — short-list of avoidance candidates |
Approximating the Strategy in ScreenerHub
ScreenerHub provides a practical shortlist using ROIC and EV/EBITDA. These substitutes do not reproduce Greenblatt's original calculations or the combined ranking. The ROIC filter requires Pro access.
Recipe 1 — Practical shortlist
| Filter | Setting |
|---|---|
| Sector | Exclude Financials, Utilities |
| Market cap | > $300M |
| ROIC | > 12% |
| EV/EBITDA | < 12x |
| Revenue | Positive |
Start by sorting ROIC descending and compare EV/EBITDA in the adjacent column. Studio sorts by one column at a time: clicking EV/EBITDA replaces the ROIC sort. This shortlist does not calculate a combined Magic Formula rank. Inspect unusually high ROIC values and negative EV/EBITDA multiples before adding a company to your research list.
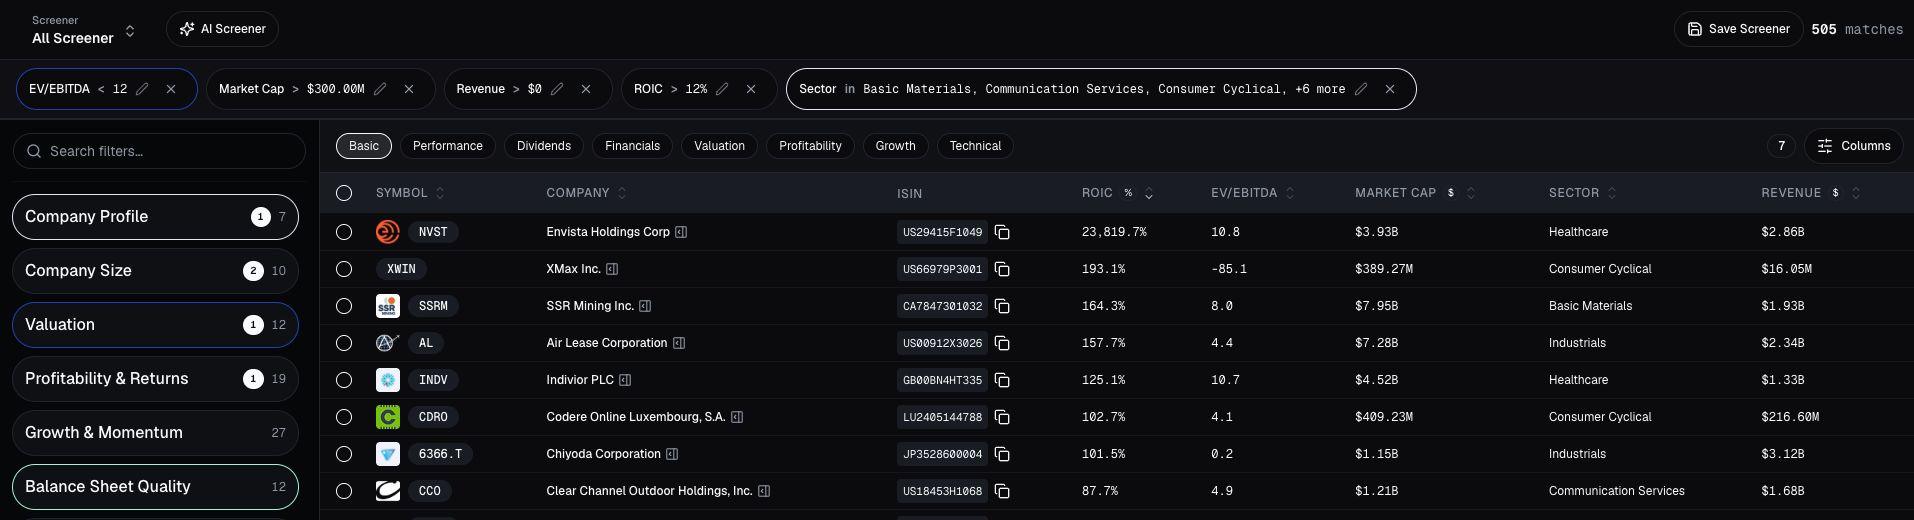
A value-and-quality shortlist sorted by ROIC descending. Captured September 23, 2026; matches and prices change. Select the image to view it full size.
→ Open the complete shortlist in Studio →
The link loads all five criteria and the relevant result columns. The sector rule uses In list to select the nine other sectors, leaving out Financial Services and Utilities. Review the criteria before saving; monetary examples use USD.
Recipe 2 — More conservative (large-cap only)
| Filter | Setting |
|---|---|
| Sector | Exclude Financials, Utilities |
| Market cap | > $2B |
| ROIC | > 15% |
| EV/EBITDA | < 10x |
| Debt-to-equity | < 1.0 |
This shrinks the universe to large, financially sound businesses. Better for investors who want lower drawdowns and are willing to give up some upside.
Recipe 3 — Quality-tilted variant
| Filter | Setting |
|---|---|
| Sector | Exclude Financials, Utilities |
| Market cap | > $500M |
| ROIC | > 20% |
| EV/EBITDA | 6x – 14x |
| Gross margin | > 30% |
Pushes the formula toward genuinely high-quality compounders at acceptable valuations. Fewer, better names — and a tighter overlap with quality-compounder strategies.
When the Strategy Misleads
The Magic Formula is a screen, not a verdict. It has a handful of well-known failure modes investors should respect.
- Cyclical EBIT peaks. Steel, shipping, and chemicals can rank brilliantly near the top of a cycle. Three years later, the same stocks look cheap for a reason. Always check the multi-year trend in EBIT and margins.
- Accounting-quality drift. Stocks can rank well on reported EBIT but carry weak free cash flow, aggressive revenue recognition, or rising working capital. A Piotroski F-Score overlay catches most of these.
- Sector clustering. In any given month the top 30 names often cluster in 2–3 sectors. Equal-weighting helps, but a sector cap (e.g., max 25% per sector) is a sensible discipline.
- Patience required. The strategy has historically underperformed the index in roughly 1 of every 4 years. That is part of why it works — but only for investors who actually hold through the bad year.
- It is not a thesis. The formula gives you a shortlist. Reading the 10-K is still your job.
Magic Formula vs. Related Strategies
| Strategy | What It Targets | When to Prefer It |
|---|---|---|
| Magic Formula (this page) | Cheap + capital-efficient | You want one rules-based core value strategy with minimal moving parts |
| Piotroski F-Score | Improving fundamentals in already-cheap stocks | You want a balance-sheet quality overlay on a deep-value screen |
| Graham Number | Hard valuation ceiling | You want a strict price-anchored value approach |
| Quality compounders | High ROIC + low debt, valuation secondary | You prioritise long-term compounding over current cheapness |
| Value screening | Generic low-multiple stocks | You want a broader funnel before applying any quality filter |
Frequently Asked Questions
How many stocks does Greenblatt recommend holding?
Between 20 and 30 equal-weighted names, added in tranches across the year. Fewer names increases single-stock risk; more names dilutes the ranking edge.
How long should I hold each position?
Twelve months. The one-year horizon is deliberate — it lets the value and quality premia play out and qualifies winners for long-term capital-gains treatment in most jurisdictions.
Does the Magic Formula still work after 2005?
Live-money results since publication have been more modest than the original back-test, with multi-year drawdowns versus the index. The framework still produces a defensible, transparent value shortlist; it is no longer a guaranteed alpha source.
Why exclude banks and utilities?
EBIT and the operating-capital denominator are not comparable for financial businesses (interest is core revenue) or for rate-regulated utilities (returns are administratively capped). Including them distorts the rankings.
Can I run the Magic Formula on European or emerging-market stocks?
Yes — the logic is geography-agnostic, but coverage and accounting comparability are weaker outside the U.S. and large-cap Europe. Stick to liquid, well-covered universes and apply sensible market-cap floors.
Keep Learning
- What Is the Magic Formula? — the concept behind this strategy
- What Is ROIC? — the practical quality factor used in the screen
- What Is EV/EBITDA? — the practical valuation factor used in the screen
- What Is the Piotroski F-Score? — a useful quality overlay on any value screen
- How to Screen for Value Stocks — a broader value workflow
- How to Find High-Quality Stocks — the quality side of the equation